Monday 17 December 2012

The Hockey Stick and the Climate Wars

I love depressing books. Give me characters that make the wrong decisions and slowly crumble ever after because of it. Give me gross injustice. But I want it to be fiction; I like suffering as a concept, as an art, not as something that happens to real people.
I just finished a book that has plenty of injustice and suffering in it; unfortunately, it wasn’t fiction. It made me sad and frustrated. I knew it would. It was “The hockey stick and the climate wars - dispatches from the front lines”; the account of Michael Mann of the creating of the famous hockey stick graph, and the subsequent barrage of the denialist lobby on him, his colleagues, and his work.

The book describes the changing times; it starts with Mann’s early career, when climate science was still just another science. It describes the research that lead him and co-authors to publish the hockey stick in the late nineties, and its incorporation in the IPCC’s third assessment report in 2001. And that was when the excrements hit the fan. As the hockey stick makes the problem of anthropogenic warming readily understandable to all, and featured prominently in something as influential as the IPCC report, it was a target the petroleum lobby could hardly ignore. Mann describes his utter unreadiness  for the attacks that came; he was just a scientist, trained in scientific discourse, and not in mud-throwing with lay people. Very, very recognisable, I suppose, to any scientist.
The cycle of attack and counter-attack followed the political diary; attacks intensified in 2003, as the Climate Stewardship Act would be voted on; if it would pass, emissions of greenhouse gases would legally have to be curtailed. Denialists tried everything to discredit the evidence; none of it stood up to scrutiny, but they did create doubt. And the bill didn’t pass. Because of the denialist lobby? Hard to say, but the fact that that possibility can’t be excluded is chilling.
In 2004, Mann and colleagues realised you can’t fight this battle in scientific literature, as their opponents would generally not venture there. Neither does the general public. If you want your voice to be heard, you have to find other outlets; the RealClimate blog was founded. 

 The RealClimate blog
Then the battle got harder. The year 2005 saw the attack of republican senator Joe Barton, who either thinks, or wants others to think, that any science suggesting the existence of anthropogenic warming is fraud. He demanded from Mann and several others all the information their work was based upon, all correspondence about it, the dates of any relevant meeting, and more of such absurdities. Is there anyone in the world who can give such a detailed account of their work? Luckily Barton had no legal ground to stand on, and the climate scientists could ignore him, but it was clear that the deniers were stepping up their game. If they could enforce such demands, work would be impossible for climate scientists. Exactly the desired effect. And just the threat of this lingering in the air might put people off from letting their voice be heard.
I remember this attack happening; I was doing my PhD in Amsterdam at the time. We were all upset and worried. And one of us was courageous: Gerald Ganssen, our colleague, and then president-elect of the EGU (European geosciences Union), was the first to stand up and condemn this attack. I was proud when I read this event narrated in the book. After the EGU many other scientific organisations spoke out.
In 2007 things were looking up; Al Gore drew global attention to global warming with his Inconvenient Truth lectures, film and book. Together with IPCC, he received the Nobel Peace prize. It looked like the deniers had lost, and science prevailed. But it was not to be. The worst was yet to come.
Then ClimateGate hit the global headlines. Private emails were stolen, and taken out of context. As Mann phrases it: "imagine how unpleasant it might be to have your private emails, text messages, or phone conversations mined by your worst enemy for anything that, taken out of context, could be used to make you look bad". That’s exactly what happened. And the right-wing media lapped it up. And it worked: a lot of doubt was cast, again, and the timing was pristine; the e-mails were published just before the Copenhagen Summit, and everybody knows what a success that was. And if that publicity stunt wasn’t enough, Mann also describes attempts to bribe his colleagues into accusing him of fraud. It didn’t work. And he quotes from some of the hate mail he received. Did I mention already this book is not a happy read?

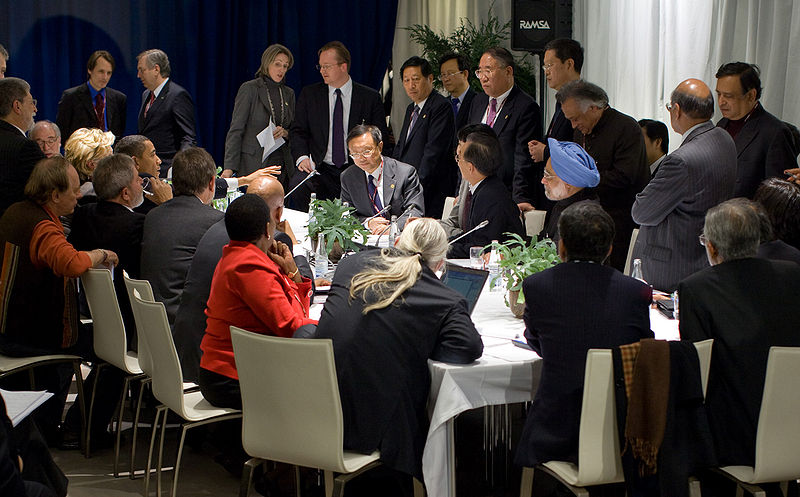
At the 2009 United Nations Climate Change Conference (Copenhagen Summit)
Several official investigations were performed to check if anything untoward was uncovered by the hacking of the emails. All investigations concluded it hadn’t: all scientists were cleared of any wrongdoing. Unfortunately, that fact was conveniently ignored by most mainstream media. The scientific community noticed, of course, and was relieved, but the damage done to public perception of climate change hasn’t been undone.
The clearing of the scientists didn’t stop the attacks, either; in 2010, attorney general Cuccinelli tried the Joe Barton strategy once again, demanding impossible amounts of documentation on Mann’s work. Again it didn’t work; a legal base for any investigation was (again) found lacking. But it did clearly convey the message that when you were a climate scientist, you were still considered fair game.
Mann ends the book on a positive note; he says awareness of global climate change is growing, as is insight into the machinations and funding of the denialist lobby, and thereby their credibility. Public indignation on how bona fide scientists are treated is increasingly voiced. Would this time the tide really be changing? Let’s just hope so. And Mann himself? He has clearly not lost any of his fighting spirit. He concludes with “I am determined to do whatever I can to make sure it will be possible for us to return (to the Florida Keys, MHS) decades from now – my wife and me, our daughter, her children, and perhaps theirs – to again marvel at these natural wonders. While slowly slipping away, that future is still within the realm of possibility. It is a matter of what path we choose to follow. I hope that my fellow scientists – and concerned individuals everywhere – will join me in the effort to make sure we follow the right one”.
Florida Keys

I hope countless many people read this book. It provides an unprecedented insight into the war between science and oil industry. And it’s hard to read about an author of such ground-breaking work being bullied and threatened, but it’s uplifting to see it hasn’t broken him. And the book is both well-written and incredibly well-documented; it has over a hundred pages of notes.


While reading it, I did hear the voice of the devil’s advocate in the back of my head. “Of course he would say that! Of course the denialists can’t get their criticisms published in scientific literature – it’s a conspiracy!” And all that. And of course the book is subjective, by its very nature. But if you adopt the assumption climate science really IS a hoax and/or a conspiracy, you have to accept that it has the legal systems all over the world in its pocket. Otherwise all the investigations into the conduct of the conspirators would have yielded something. And if it has such power, than how come it can’t seem to force emission reduction legislation into being? Wasn’t it a conspiracy to bring the leading economic nations to their knees? Not a very effective conspiracy, then. Or is all that power then used to maintain the status quo, where climate science wrongly claims that global warming is occurring, the powers that be are allowed to ignore that and keep emitting greenhouse gases, and though climate change doesn’t happen, the scientists will still get funded to study it? That sounds a bit ineffective too. The only logical explanation of all of this is still, I’m afraid, that climate scientists simply are bona fide. And if nobody listens to Cassandra in a white lab coat, reality will catch up all too soon…
I know most people considering reading this book will already be at the side of science, and it is therefore unlikely to change many people’s minds on climate change. But it does provide a compelling read. Do judge for yourself!

...and some shameless self-promotion to end with...

Monday 3 December 2012

Finally quantified


“Sea-level rise finally quantified”. That was a header on the BBC news website this week; it looked nicely definitive. Now we know how much sea level rise there is! Or do we only know that BBC news headers are short?

The header of the actual article was a bit more precise: “Sea-level rise from polar ice melt finally quantified”. It still sounded definitive. And it also sounded like it had never done before; finally, that lack of knowledge has been resolved. Is that true? Or do we now only know that 53 characters is still too little to say anything scientific?

The article gets to the point quickly; the first sentence is “Melting of polar ice sheets has added 11mm to global sea levels over the past two decades, according to the most definitive assessment so far.” A sentence only slightly bigger than a large tweet, but it carries the essence of the journal article in Science it discusses. There had been estimates of how much polar ice sheets contribute to global sea level before, but this time researchers from 26 institutes had pooled their knowledge, and together produced a result that was much more reliable than all individual efforts. What they come up with, though, still has a large uncertainty: the figure presented is 11.2 +/- 3.8 mm.

 A beautiful picture of the Antarctic Ice Sheet, found on Wikipedia, and taken by my dear old colleague Stephen Hudson.

Why is quantifying the mass balance of ice caps so difficult? There are two main methods of measuring this: one is satellite altimetry, and the other one satellite gravimetry. Satellite altimetry simply measures the top of the ice sheet and calculates its mass from that. And there are two main challenges associated with that: the first concerns the top of the ice sheet. Are you measuring the top of the ice? Or perhaps the top of several metres deep a pack of snow? It matters a lot for the mass you will calculate from your height measurements. 

The other problem concerns the bottom of the ice: you can’t measure that with your altimeter. You have to estimate that from other data, which might be somewhat imprecise. So if last year your measurement of the top of the ice at some point on an ice sheet was 200m above sea level, and this year it is 201m, does that mean there is 1m of ice more? Or has 5m of ice melted off, the whole continent bounced up half a metre as a result, and 5.5 m of fresh snow fallen on top? It’s an extreme example but it does illustrate the difficulties involved.

Satellite gravimetry measures the gravitational pull of the ice sheet concerned, so it needs not distinguish between snow and ice. But it sure needs to distinguish between ice and rock. This can in practice only be done with modelling, and that produces some of the uncertainty that is hard to get rid of. 

Another difference between altimetry and gravimetry, which can be used to one’s advantage, is that altimetry is localised, while gravimetry gives by definition a regional figure. If you use the one to verify the other, the accuracy of your estimates increases. 

A picture of Greenland, also from Wikipedia

The authors of this Science paper combined not only these different approaches, but also pooled the data from all the institutes they represent. That way they acquired much longer time series, and thus higher accuracy. If you have overlap in time and space you can calibrate the various data sets with each other. Their figure of 11.2 +/- 3.8 mm sea level equivalent mass loss over the period 1992-2011 can be considered the best available. 

In the Science paper, numbers are also given for the individual ice sheets, and for various time periods. These results show that East Antarctica is mainly gaining mass; that makes sense, as warmer seas tend to produce more snowfall over the continent. All the other ice masses (West Antarctica, the Antarctic Peninsula, and Greenland) are consistently losing mass. And all of them are accelerating; both Greenland and the Antarctic Peninsula display a four-fold increase in annual mass loss between 1992-2000 and 2000-2011. West Antarctica melt doubles between these periods. The mass that East Antarctica gains in the latter period is outweighed (by a factor of almost 2.5) by the loss of the rest of the continent. 

The authors of this work do not discuss the future, but one can hardly resist mentally extrapolating the graphs shown. A rise of 11 mm in 20 years may in itself not be much, but half of that has happened in the last 5 years. And this is only the polar ice caps; there is of course also the influence of factors like thermal expansion and melting low latitude glaciers. It would be nice if a similar effort was made to reconcile all records of the remaining components of sea level rise, and bring the uncertainty of these to a minimum as well. The real pressing question, on what the future will hold, can only be begun to be reliably answered when we know what is going on right now…


Wednesday 10 October 2012

Fingerprinting the ocean


Which is more likely to cause flooding in Europe; the Greenland ice cap or the west Antarctic ice sheet? They are both currently melting. And we can measure how fast, but it’s only been a recent development we have satellites that can resolve this, so it’s hard to draw conclusions on future melt rates from that. We might want to look at the past. And glaciologists have ways to find clues on how big ice sheets have been in times gone by (like they show here), but that information is often patchy. Sea level itself provides clues too. There are ways of telling where water that runs into the oceans has come from.

If you have an ice sheet, and a part of that ice sheet melts, several processes take place. The ice sheet becomes lighter and smaller, causing the Earth’s crust to bounce back up like a lilo, and the ice also lessens its gravitational pull on the sea water around it. The whole sea would in effect flow away from the shrinking ice sheet. So strangely enough, the most sea level rise you would find would be on the other side of the globe. Near the ice sheet, relative sea level would only fall.

Modelled results of what happens if 1mm sea level equivalent melts from the Greenland Ice Sheet: the resultant sea level change ranges from <0mm (blue) to>1.2mm (dark orange). From: Mitrovica, Tamisiea, Davis and Milne, Nature 409, 2001

So what if the Greenland ice sheet melts? That would be ~6m overall sea level rise, so that would be felt everywhere, but the southern hemisphere would be hit hardest (apart from the northern hemisphere having many more big cities in low-lying coastal areas). For Europeans, it’s the west Antarctic ice sheet that’s the main threat.

So how can that feature be used? If you want to know where past sea level rises originate from, you need to make reconstructions at a wide range of latitudes. The spatial pattern of where the rise is highest to where it even may be negative will tell you where the water involved came from. Simply speaking, the hemisphere where you find the smallest rise is the culprit. This process is called "fingerprinting"; this term has a rather chemical ring to it, but sea level scientists use it in a more spatial way. And if you can then find out under what circumstances it is which ice sheet that reacts, you may get an idea of what will happen in our future. And that is information of which it is quite imaginable it will be ignored by the relevant authorities, but at least everyone with access to scientific literature will have an idea of where not to buy a house...

Wednesday 19 September 2012

Big change for small Arctic creatures


Sometimes it’s important to study the obvious. Among almost all, except some right-wing Americans, it is known that we are experiencing a period of rapid climate change. And with climate change come biological changes. But it matters to find out what exactly is happening; to get an idea of the scale of the phenomenon, and of how various aspects of it interact. So even though everybody can guess that the Barents Sea is warming, and that that must influence whatever small critters are living at its bottom, I spent two years trying to figure out what the difference really was between, roughly, 20th and 21st century foraminifera in that basin.

Some of the foraminifera species we studied

How did that all come about? In the 90s, Morten Hald, Per Ivar Steinsund and Sergei Korsun had made an effort, collecting all available information on which foraminifera species lived where. And in the years 2005 and 2006, a vessel of the Norwegian Institute of Marine Research had gone and collected samples in the same area. My job was to analyse these samples for foraminifera, and compare my findings to the database of foraminifera assemblages that had been compiled. The paper is published in Global and Planetary Change, as 'Changes in distribution of calcareous benthic foraminifera in the central Barents Sea between the periods 1965-1992 and 2005-2006', by M.H. Saher, D. Klitgaard Kristensen, M. Hald, O. Pavlova, and L. Lindal Jørgensen, to be found here

We found changes indeed. At my sample sites, temperature had on average increased by almost 1°C. All the cold water species had lower abundance in the 21st century than in the 20th. Evident? Maybe. But yet another small piece in the whole picture of how exactly various species respond to climate change.

Our main goal had been finding out which species had changed in abundance and how, but just out of curiosity I also wanted to calculate how big the total change had been for each sample. I found an appropriate method for quantifying change, calculate a value for each sample, and had some mapping software produce a map of the results. When it came out I was surprised to see a clear pattern. A band of highest amplitude of change followed the general outline of the maximum ice edge in spring. I hadn’t expected that!
The main figure in the article (but changed in style as to not breach copyright), with the yellow circles indicating the amount of change between the 20th and 21st Century as found in the foraminifera assemblages.


The maximum ice edge is a place where many things come together. In the Barents Sea, inflowing Atlantic water mixes with polar water. Where these waters meet tends to be where the ice edge is. Atlantic water is too warm to freeze over. And the water covered in ice doesn’t receive much sunlight, so there isn’t much life that can eat the nutrients in the water; at the ide edge, the wind can stir them from underneath the ice. That makes the ice edge a very productive region. And now we found it is not only where life is abundant, but also where it changes in abundance.

So what are the implications of this? With the cold foraminifera species vanishing from the Barents Sea, they may soon vanish altogether. They can’t move much north from there. Will anybody miss them? They are not charismatic macrofauna, after all. But it would be a few more species gone, which are fascinating, if only you are willing to find out.

And if there was already such change happening in the pre-2007 years, it would have been very interesting to see what 2007, the epicyear of low sea ice, would have shown. That year is famous for its summer ice minimum; not its spring ice maximum. But that was low too. 


The extent of sea ice in March 2007; March is normally the month with the largest extent. The area has dropped steadily over the years (left) with a big dent in 2005-2007. After 2007 it has been rather stable. Data: Fetterer, F., K. Knowles, W. Meier, and M. Savoie. 2002, updated 2009. Sea Ice Index. Boulder, CO: National Snow and Ice Data Center. Digital media.


The research vessel did set out to collect samples in 2007. Unfortunately, the weather was too rough, and no samples were collected. The next year, the ship didn’t even go. So there is still much to find out at the bottom of the Barents Sea. I hope some time in the future, someone will go back there, collect samples, and then write a comparison with both the 20th century database and this work. I am quite keen to see what’s going on there in the post-2007 years…

Friday 17 August 2012

How high was sea level in the last interglacial?

Let me start with a disclaimer: I will not give a definitive answer to the above question. That being out of the way I can now freely discuss the difficulties of trying to answer a question like that.

It is, in a way, an interesting question: the last interglacial was only ~125.000 years ago, so the continents were all practically in the same location as they are now, and the oceans were equally deep. We know from ice cores and fossil plants and such things how high CO2 levels and CH4 levels in the atmosphere were. We know from ice cores, microfossils, and many other sources how warm it approximately was. So you could say that if you know how high sea level was back then, you know how high sea level is at these CO2 levels and these temperatures, and that might be useful. Additionally; if you can reproduce that in a climate model, you have reason to believe your model resolves sea level well, and may be able to predict it too. Unfortunately, it's not that simple. 


Picture of the 1953 flood

One thing is that we had already passed the CO2 levels of the last interglacial when the Mauna Loa observatory started measuring in the fifties. We may not yet have reached reached globally averaged temperatures comparable to those of 125.000 years ago, but it's hard to pinpoint that; every place on Earth has its own temperature history, and it's not easy to compare two periods that are so similar. And ice does not melt instantaneous. Just suppose we reach, this very day, the very temperatures we had in the last interglacial, the ice caps won’t have had time to adjust to that. And we don’t give them any; temperatures keep rising. We can only get an equilibrium when the situation remains stable for a while. That won’t happen in our lifetime!

So apart from the issues associated with a comparison, we still have this sea level issue to deal with. If you talk about “sea level” in a given time, without further specification, it almost automatically means “globally averaged sea level”. And the problem with that is that you can perhaps measure it today; satellites scan the entire Earth surface, and you can calculate the average of all their data. And sea level famously isn’t level; temperature differences, the rotation of the Earth, wind, gravitational pull of things such as ice sheets and so on, all make the sea surface rather bumpy. So you can’t measure past global average sea levels (further back than the satellite era), as it’s not possible to make a sea level reconstruction for every location on Earth covered by sea. So what can we measure? Local sea level, evidently.

There are many ways of reconstructing local sea level (such as this, this, this, this, and this), and every method, of course, has its own caveats. They also might not represent the same aspect of sea level; some might e.g. reflect low tide, while others are more representative for mean sea level. And tide ranges don't stay constant over time.

And if you have produced a local sea level reconstruction, you're not done; you also have to take into account that not only sea level in itself, but also the Earth’s crust might have gone up and down. Locations affected by earthquakes, volcanism, or (occasional) ice cover are prone to do a certain amount of moving vertically, and fast enough to pose a problem over the time scales discussed here. You can, of course, only use stable regions, but that leaves you with quite a small number of data points. An iconic paper by Robert Kopp and co-workers in Nature tried to extract a global average from a limited amount of data from the Last Interglacial. They, for instance, had no data points along the eastern and western shores of the Pacific; the only data from that ocean came from islands in the middle, and from its polar boundaries. They come up with an average of ~7m higher, but given the data scarcity it is hardly surprising they give rather large uncertainties. And these 7m, being a global average, of course are only a mathematical reality; at any specific location the value may be drastically different. 


The difficulty with reconstructing sea level also makes its prediction difficult.We only have good data coverage over the last few decades, and only moderate coverage over the last few centuries. If your sea level model manages to hindcast the patterns observed in that time interval, that doesn't necessarily mean it can resolve anything novel happening, like, say, the collapse of the West Antarctic Ice sheet. And that's exactly the sort of things we would like to get a handle on.

So if you headlines in the newspaper, on Twitter or wherever, that say something along the line of “sea level in period X (say, the last Interglacial) was #m higher/lower than today”, do realise it could mean all sorts of things. If one person for instance claims sea level was likely to be 8m higher than today in the Last Interglacial, and you read somewhere else it was 8m lower, it doesn’t mean one of them has to be wrong, as much as climate skeptics would like that to be the case. In this case it concerns one global average, and a local record from the Netherlands. And it's many, very many of such results, which may seem contradictory, that altogether will paint a comprehensive picture of past sea level. And in the long run, this will hopefully give us a solid grasp on future sea levels.

Saturday 4 August 2012

Conversion of a skeptic. Really?


The New York times let him write an op-ed. The Guardian blogged about him. The BBC had a piece about him on their news website. The Carbon Brief interviewed him. Twitter was buzzing with his name. Richard Muller was the talk of the day. Why; had he discovered something exceptional? Had he found the cure for cancer? Had he solved the hunger problem? No. He had found something out that had already been known for decades. So why all the excitement? I’m not so sure!

So what was the issue? Muller suspected there was something wrong with the current global average land temperature records. So he set out to investigate. Land temperatures are, of course, only a small part of the climate story, but he does have a point that most humans reside on land, and are therefore much more interested in land temperatures. And these are hardly independent of the ocean temperatures; the oceans have a much higher volume and heat capacity than the land (or rather; the atmosphere at a little bit above the surface, where land temperature is traditionally measured). But one can only do so much at any given time. And measuring temperatures is hampered by urbanisation and uneven distribution of measuring stations. So far no problem: it's always good if someone keeps a critical eye.

It took him and his co-workers a few years to trawl through the data. They’re done now; the accompanying manuscript has been submitted to JGR. His conclusions: actually, the records are fine. Temperatures are rising. And he goes further: humans are too blame. So far still so good. It had long been established, but there’s nothing wrong with corroboration.

Muller in action

Was that what all the buzz was about? No, it was about his conversion from climate skeptic to climate, well, scientist. Does it matter? Maybe! People like senator Inhofe have one person less to point at, saying that scientists have no consensus (like these people) and climate change is a hoax. And that’s good.

But does it mean Muller is a lighting example for climate science? No. His article is not yet published; it will be up to the editors of JGR whether he did a thorough enough job for his work to be published. If he does then we have another interesting article. But with Muller it seems not be about what he publishes, but what he says outside science. And that makes my hair stand up. Listen yourself to what he says here. My problems with these things are (in more or less chronological order):

1)    He sees a distinction between global warming and climate change. He only acknowledges the first. He acts as if these things are not related. But every rational person will see that atmospheric temperature is an aspect of climate, and that, for instance, temperature and ice volume are not independent. If you only look at land temperatures you’re missing most of the story. If you think climate change goes away when you disprove a rise in land temperature you’re not a very believable scientist. Just pointing out that some people attribute Hurricane Katrina to global warming, which indeed can’t be done, does not mean global warming is not part of the much wider process of (anthropogenic) climate change.

2)    He claims the US CO2 output is dropping. That’s not in the paper, that’s not a statement backed up by data. I struggled to find recent data on this. This blog gives a graph, and it indeed shows a decline, but the figures are provided by BP, and the report they came from  has a disclaimer that says "BP regrets it is unable to deal with enquiries about the data" so I won't take their word for it. I do hope Muller is right, but I would like him to point out where he got the data from. 

3)    His thoughts on the solution boil down to: change China! I’m not saying China does not pollute, or that it pollutes a lot, but it’s not helping if non-Chinese get all patronising and want to “help” China to develop clean technologies, while proclaiming that they themselves are not the problem and don’t have to cut down on their own pollution.

4)    He dismisses 90% of Al Gore’s Inconvenient Truth without getting into detail on what exactly is wrong with it. In the scientific community, this film/book is accepted as largely correct.

5)    He attributes global warming to humans, simply by fitting the temperature curve and the CO2 curve. And many of us have done such fitting exercises, but it's not the pinnacle of science. Muller, however, claims he has done a better job than anybody had before. That is blatantly untrue: lots of proper research (like this for instance) has been done on attributing climate change to various causes.

6)    He lashes out at Michael Mann, using false arguments. He for instance says Mann denies the existence of the Medieval Warm Period, while in reality, Mann is one of the main authors to discuss this feature (e.g. here). Do read Mike Mann’s Facebook page, by the way (it’s public); he has gone through the effort of dismissing all the false statements, with links to proof.

So what is my conclusion? I think Muller just likes the limelight. I would pay attention to what he manages to get published, as that will have withstood a critical eye. But I don’t believe a thing of what he says which is not backed up by solid evidence. A man like this might be more a Trojan Horse than anything else: pretend to be a bona fide scientist, and as soon as people believe that, fill their minds with rubbish. Watch out for Muller! And do to him what he did to the temperature records: first evaluate it properly, and only then decide if you believe it or not…

Monday 30 July 2012

The Greenland story


It was all over the news, all over the world: 97% of the surface of the Greenland Ice Sheet melting! Quite a lot of sources, including 350.org,  de Volkskrant and het NOS journal got carried away, and announced, either on twitter or on national TV, that 97% of all Greenland ice was gone. They should have spent a second to ponder this: for instance, the offices of de Volkskrant would be flooded if that had indeed been the case. But 97% of the surface experiencing melt is spectacular enough in itself. Generally, no more than 50% undergoes melting in summer. 97% is really rare.

Some twitter sources also mentioned this event had been predicted. In an article, that attracted quite some attention, Jason Box of Ohio State University, and co-workers, stated they expected melt over 100% of the surface to occur in the near future. So what did they base that on, and were they really that precise?


The map showing decreased reflectivity over almost the whole of the ice cap, which gets the bulk of the attention.

Box et al. studied the reflectivity of the Greenland ice. Reflectivity, or albedo, is one of these things that stabilises ice sheets; it reflects sunlight back so effectively that the radiation can hardly make a start at melting any ice before it finds itself reflected back into space. But if high temperatures manage to get the melting process going, this lowers the reflectivity, and then your ice and snow are in peril. This self-reinforcing process, also known as positive feedback, might well herald your ice cap’s decline. What’s even worse is dirt blown on top of the snow; this may start melt at lower temperatures.
So what did Box and his fellow scholars do? They basically measured reflectivity and melt from a satellite, calibrated these results with observations from weather stations on the surface, and ran a climate model in order to get an idea of the sensitivity of the reflectivity to temperature. And what is so new about this research? Satellites have been measuring the albedo of Greenland for many years, and ground-truthing with weather stations has been done since early days too. But the results of Box et al. go all the way to the year 2011, bringing this research up to date. And their combination of observations and modelling could potentially give new insights in how the process works.

Observations of reflectivity
So what did Box and colleagues find? The reflectivity of the Greenland Ice Sheet is at a low point; 8% lower in 2011 than it was in 2000. And this is not an incident; they have observed a significant trend, though admittedly a short-term one. They further found a 26% increase in melt between 2000 and 2011. And to give you an idea of how much that is: if that rate would remain constant at 2011 level, the ice cap would be lost in roughly 6000 years. And the sensitivity of the reflectivity to temperature? That’s where it gets confusing. Over large areas of the ice sheet, reflectivity only goes up with higher temperatures. This can be explained by warm air bringing in more snowfall. But strangely enough, snowfall doesn’t always correlate with higher reflectivity in their data. And when you look at the sensitivity of the reflectivity to temperature, or in other words; by how much the albedo goes up or down with every degree temperature change, it becomes clear that their data is only statistically robust in the regions that are melting already.
The authors warn that they think summer melting will occur over the entire ice sheet in another decade, if the coming years will be like 2010 and 2011. But that is a big “if”. Box emphasizes only the decreased reflectivity in his own blog post, without being too specific about the lack of straightforward relation with actual melting. The big take home message of this paper might be that the processes governing ice melt are not yet sufficiently understood. And we want to understand it, if only to get an idea what we should do with our coastal defences. The amount of melt in 2011 measured already translates to more than a millimetre of globally averaged sea level rise. And that does not sound like much in itself, but it does when you realise it was only 1.7 mm/year on average for the 20th Century in total; that includes for instance Antarctica, mountain glaciers, and thermal expansion.

So did they predict the ~100% melt?
Well. In a way they did. But what they really predicted was a shift to net melt over the area that nowadays experiences net snow accumulation, averaged over the whole summer. They did not mention short periods of 100% surface melt. However, you can’t get to net summer melt without, well, melting large areas of the surface once in a while. So people who say “they predicted this!” are exaggerating. But Box and colleagues are right in saying that this event greatly supports their conclusions. Given the uncertainties in their data, this was more a lucky guess than rock-hard data, yet I hope it will attract attention to the danger of Greenland melt. It’s not as if we who are alive today will ever see an ice-free Greenland, but we may well see a Greenland Ice Cap that raises average sea level by 2mm per year or more, and that is something we need to prepare for. Those who love Amsterdam, London, New York or one of these other iconic cities near sea level might wish Box luck in keeping up the good work…